Welome,
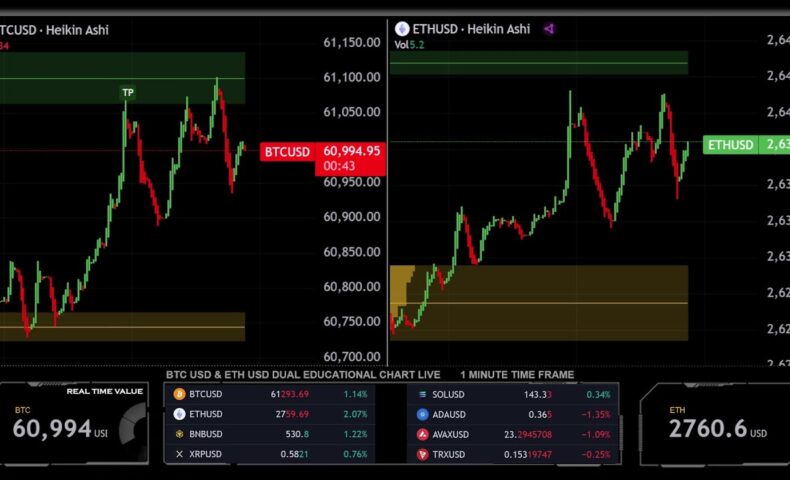
What you see is Educational LIVE Dual Educational Chart for BTC / USD ( cryptocurrency ) & ETH / USD ( cryptocurrency )
– Easy to read and understand
– With clean and simple setup
Chart is set to M1 Timeframe , means that every Candle = 1 minute
🟡 This live stream displays a trading chart. It’s a standard chart, but unlike other platforms, it’s modified to show the current market developments in a simple form and easy to understand.
🟡 The purpose of this live broadcast is to teach you basic rules and has an educational nature. On this live stream, we demonstrate how to correctly understand the market and price movements.
🟡 We do not take risks, trade, sell, or offer any financial services, and we abide by all the rules of the YouTube community.
ALL YOU SEE IS MADE FOR THIS CHANNEL AND YOUTUBE COMMUNITY ONLY.
WE SHOW HOW TO CORRECTLY UNDERSTAND THE CHART. WE DO NOT TRADE HERE.
Chart data source : Tradingview www.tradingview.com
____________________________________________________________________________________________
🛠️ HOW TO CORRECTLY UNDERSTAND SUPPLY AND DEMAND ZONES :
1, Identify supply and demand zones:
Green rectangles represent supply zone.
Orange rectangles represent demand zone.
2, Enter a potential trade in demand or supply zones:
When the price enters an orange zone (demand), check if your indicator generates a BUY SIGNAL, which could be a potential signal to buy.
When the price enters a green zone (supply), check if your indicator generates a SELL SIGNAL, which could be a potential signal to sell.
3, Enter only with confirmation from supply and demand zones:
Before entering a trade, confirm that the BUY SIGNAL or SELL SIGNAL aligns with the current supply or demand zone. The signal is stronger when it is closer to the zone, and it’s recommended to use signals that are directly within the zones. This provides a more robust confirmation of the potential trade setup.
4, Risk management.
Determine the amount of risk for each trade and adhere to risk management principles. ALWAYS Set a stop-loss to minimize losses.
5, Experiment on a demo account:
Learn and Experiment with it on a demo accounts do not use real money to better understand its behavior.
6, Watch for potential divergences:
Monitor situations where the price enters a supply or demand zone, but the indicator does not provide a corresponding signal. This may indicate a potential divergence and requires caution.
7, Monitor macroeconomic events:
Stay informed about macroeconomic events that could impact the market, as such events may influence the effectiveness of the indicator.
SIGNAL CONFIRMATION RULE: Market conditions change every second.
It is crucial to wait for the signal candle to close to confirm the validity of the signal.
Patience is key, as the signal may disappear if not confirmed by the closing of the candle.
GUIDE ON HOW TO UNDERSTAND SIGNALS and ZONES in our LIVE STREAMS is here:
____________________________________________________________________________________________
⚠️ Disclaimer:
We would like to emphasize that the information provided in our live stream, including the live trading chart with indicators, is strictly for educational purposes only and should not be construed as financial advice. It is crucial to conduct your own research and consult with a licensed financial professional before making any financial decisions,
❕ We are YouTubers, we dont trade on youtube
❕ We don’t take risks or gamble here !
❕ Everything you see here is created with the goal of teaching and educating.
❕ BE RESPONSIBLE TO YOUR SELF
❕ WE ARE NOT ENGAGING IN TRADING ON YOUTUBE !
❕ WE DO NOT OFFER ANY FINANCIAL OR MONEY RISK SERVICES.
Transparency and Disclosure:
I want to be clear that I have no financial relationships, affiliations, or sponsorships with any companies or institutions mentioned in this live stream. My analysis is unbiased and based on independent research. Remember to conduct your own research, as trading involves risks.
_____________________________________________________________________________
🌍 CHANNEL WEB SITE : www.forexeducation.live
🌍 Twitter X : https://twitter.com/Ic3WND
🌍 Linked in : https://www.linkedin.com/groups/14315510/
🌍 Mix : https://mix.com/cryptosignals222
🌍 Facebook Group : https://www.facebook.com/groups/633116828811137
🌍 Blogger : https://www.blogger.com/blog/posts/4096702608603406119
🌍 Rdddit : https://www.reddit.com/user/Hazel_SO/